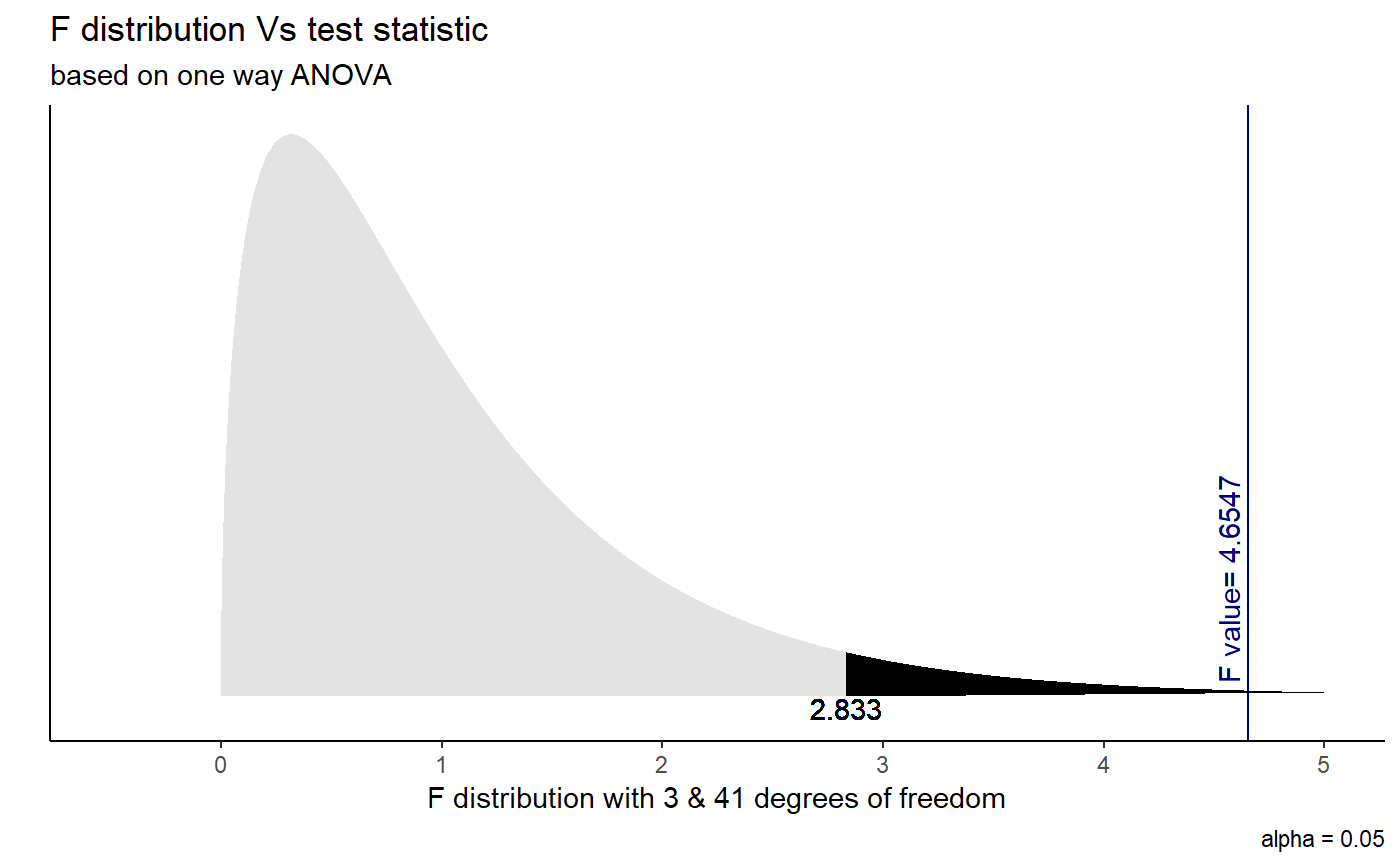
Visualise anova F-test to determine whether group means are equal
ggaov(t, alpha=0.05, colaccept="lightsteelblue1",
colreject="grey84", colstat="navyblue")
Arguments
| t | an object of class aov |
|---|---|
| alpha | alpha level for finding critical F value |
| colaccept | color for the acceptance region of the test |
| colreject | color for the area of rejection of the test |
| colstat | color of the statistic of the test line |
Examples
# 21-th day chick21 <- ChickWeight[ChickWeight$Time == 21,] chickaov <- aov(weight~Diet, data = chick21) summary(chickaov)#> Df Sum Sq Mean Sq F value Pr(>F) #> Diet 3 57164 19055 4.655 0.00686 ** #> Residuals 41 167839 4094 #> --- #> Signif. codes: 0 '***' 0.001 '**' 0.01 '*' 0.05 '.' 0.1 ' ' 1ggaov(chickaov, colaccept = "grey89", colreject = "black")
