Visualise one and/or two sample t-tests on vectors of data.
ggttest(t, colaccept="lightsteelblue1", colreject="grey84", colstat="navyblue")
Arguments
| t | a list result of |
|---|---|
| colaccept | color the acceptance area of the test |
| colreject | color for the rejection area of the test |
| colstat | color for the test statistic vline |
Examples
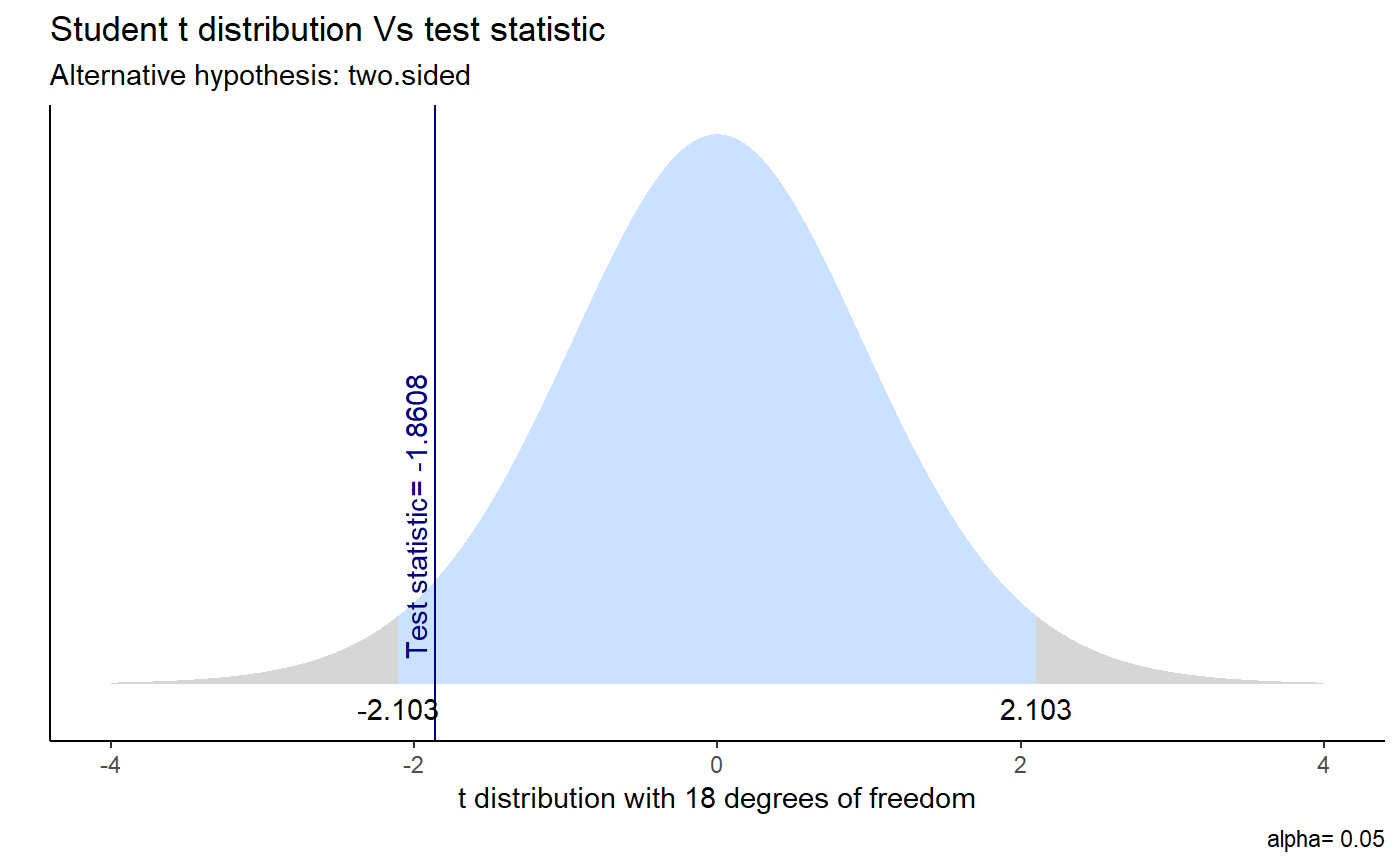
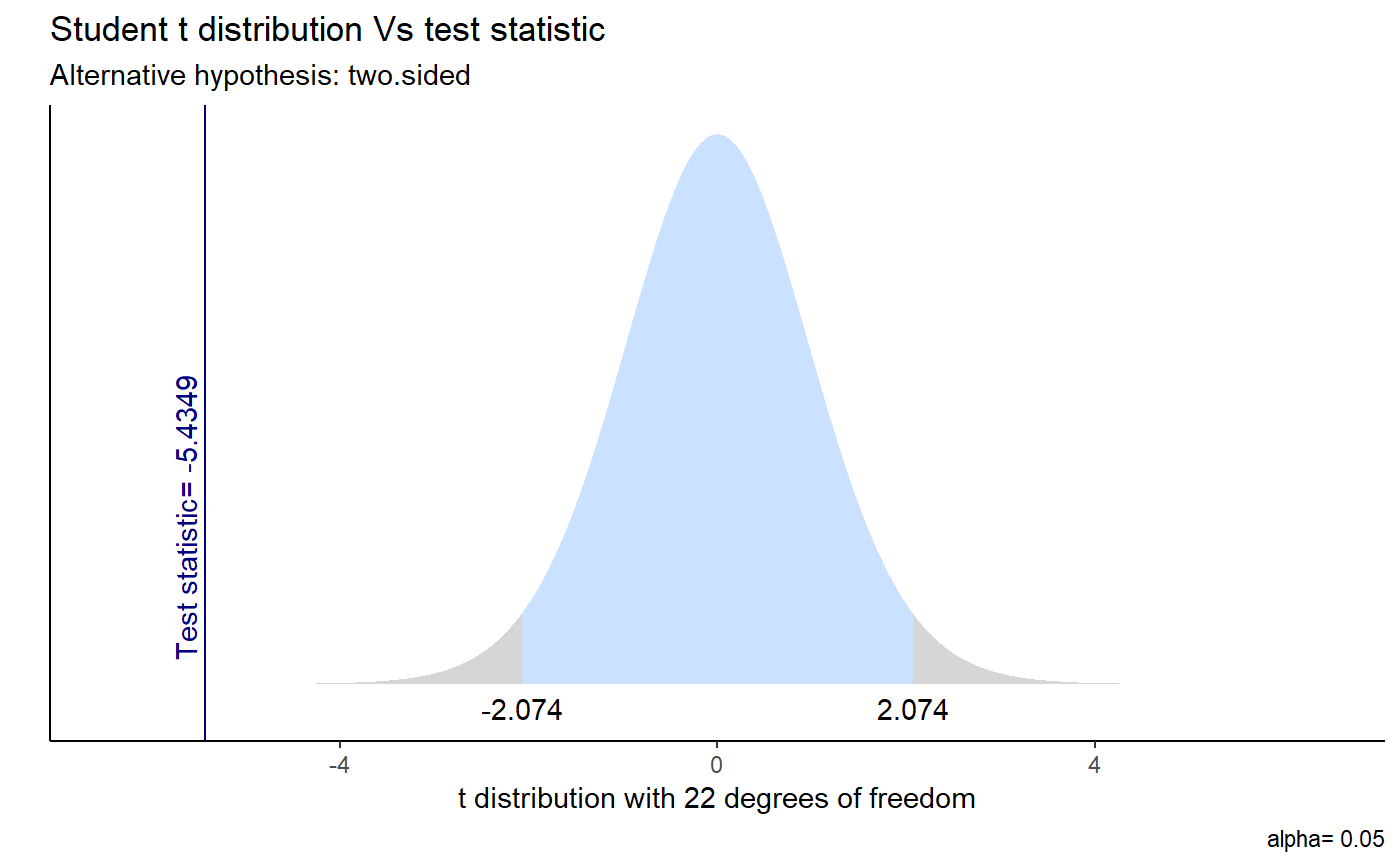
#> #> Welch Two Sample t-test #> #> data: sleep$extra by sleep$group #> t = -1.8608, df = 17.776, p-value = 0.07939 #> alternative hypothesis: true difference in means is not equal to 0 #> 95 percent confidence interval: #> -3.3654832 0.2054832 #> sample estimates: #> mean in group 1 mean in group 2 #> 0.75 2.33 #>ggttest(t_test)#> Warning: geom_vline(): Ignoring `data` because `xintercept` was provided.#> #> Welch Two Sample t-test #> #> data: 1:10 and c(7:20) #> t = -5.4349, df = 21.982, p-value = 1.855e-05 #> alternative hypothesis: true difference in means is not equal to 0 #> 95 percent confidence interval: #> -11.052802 -4.947198 #> sample estimates: #> mean of x mean of y #> 5.5 13.5 #>ggttest(t_test2)#> Warning: geom_vline(): Ignoring `data` because `xintercept` was provided.

