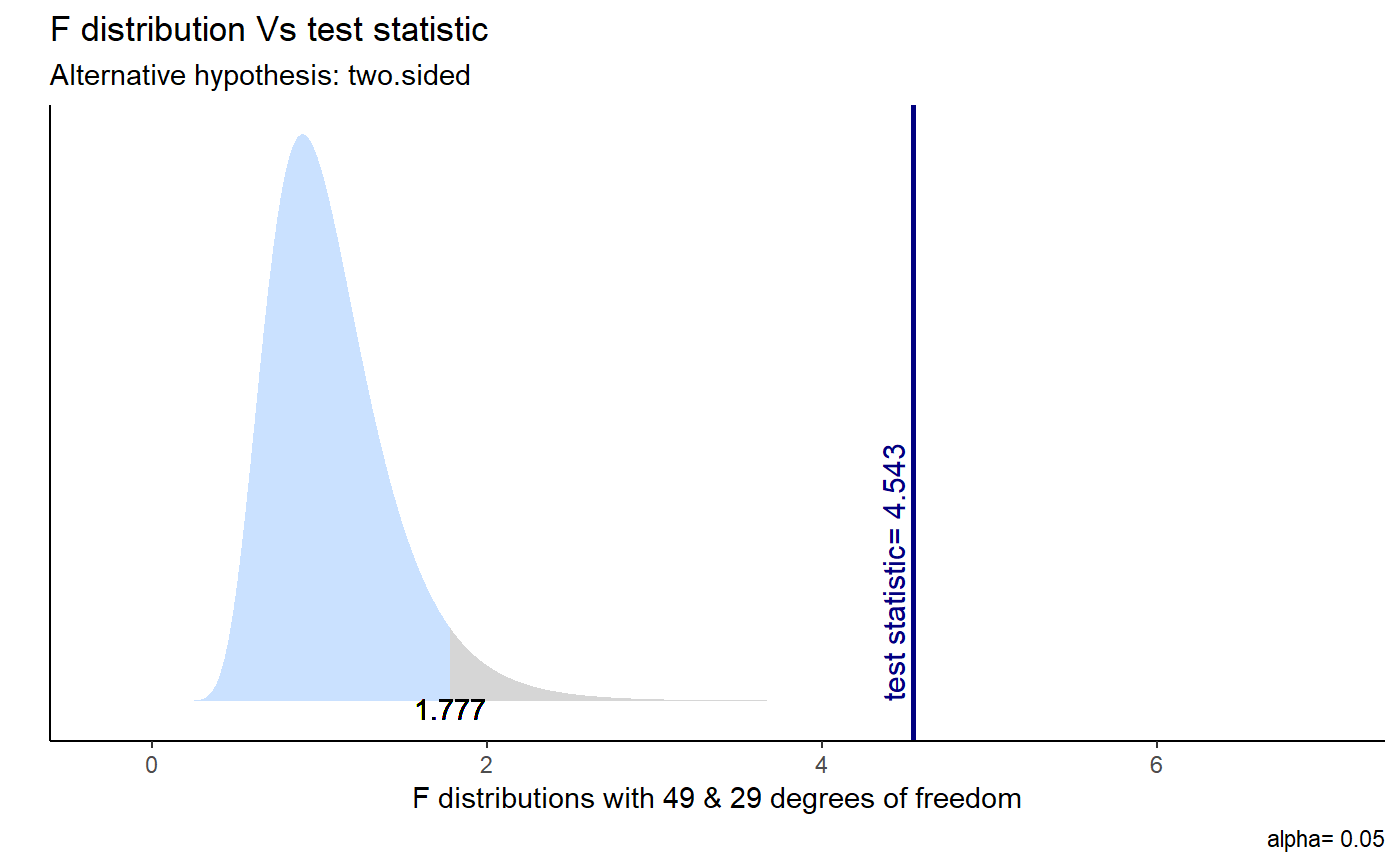
Visualise F test to compare two variances
ggvartest(t, colaccept = "lightsteelblue1",
colreject = "gray84", colstat = "navyblue")
Arguments
| t | a list result of |
|---|---|
| colaccept | color the acceptance area of the test, see |
| colreject | color for the rejection area of the test |
| colstat | color for the test statistic vline |
Examples
x <- rnorm(50, mean = 0, sd = 2) y <- rnorm(30, mean = 1, sd = 1) var_test <- var.test(x, y) var_test#> #> F test to compare two variances #> #> data: x and y #> F = 4.5429, num df = 49, denom df = 29, p-value = 4.286e-05 #> alternative hypothesis: true ratio of variances is not equal to 1 #> 95 percent confidence interval: #> 2.282479 8.547166 #> sample estimates: #> ratio of variances #> 4.542942 #>ggvartest(var_test)
